The development of the global merchant fleet is affected by a very broad range of interwoven supply and demand factors, including shipping and commodity cycles, investor sentiment, regulatory concerns, yard capacity and so on. Another factor is shore-side infrastructure projects, which can be tricky to disentangle from the wider web, though this influence is a little clearer on, for example, the LNG carrier sector…
When looking at supply and demand factors in shipping, the old adage about the chicken, the egg and their relative pedigree often springs to mind. In the case of LNG though, it could be argued that things are really quite LNG supply-led, as LNG carriers are often ordered to meet the requirements of specific liquefaction terminal projects. In fact, a commonplace claim is that each mtpa of new liquefaction capacity corresponds to requirement for an additional LNG carrier. But is this rule of thumb borne out by the data?
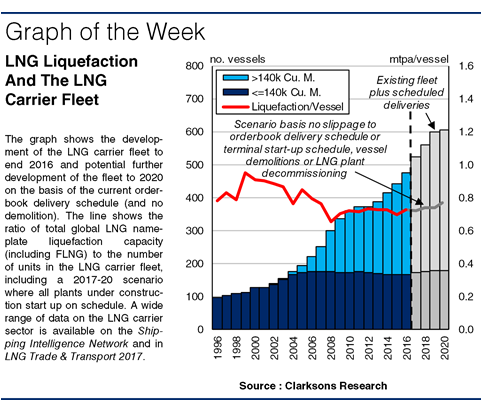
Well, at first glance, some relationship of this sort does seem to hold. In 2017, seaborne LNG trade is projected to grow by almost 10% y-o-y to top 294 million tonnes, with cargoes conveyed by a fleet of (at present) almost 500 LNG carriers. Similarly, total global nameplate liquefaction capacity is scheduled to increase by over 9%. The LNG carrier fleet is also set to expand rapidly, by over 14% in unit terms in full year 2017.
")
Looking back, a relationship is also apparent; LNG terminal capacity grew at a CAGR of just under 9% in the decade to 2007, and the LNG carrier fleet grew at a comparable 9%. Indeed, the graph shows that the annual ratio of nameplate liquefaction capacity to the fleet was generally 0.8-1.0 mtpa/vessel in the period. Vessel contracting was strongly project driven.
But in following years, the ratio slid down into the 0.7-0.8 mtpa/vessel range, as fleet growth outpaced liquefaction capacity expansion from 2007 to 2016, with a CAGR of 8% versus less than 7%. Two main factors seem to have been behind the disparity: speculative ordering amplified by Japan’s 2011 Fukushima nuclear disaster, which saw LNG carrier charter rates surge, and start-up slippage at projects such as Angola LNG (5.2 mtpa) and Gorgon LNG (15.6 mtpa). Combined with outages (e.g. in the Yemen), the result has been LNG carrier oversupply and challenged markets in recent years.
On the basis of the orderbook and the portfolio of LNG projects under construction, the mtpa/vessel ratio looks like it could still be slightly below 0.8 by 2020, possibly a worrying indicator for the fleet, though emerging US LNG export trade is likely to provide some tonne-mile upside. But LNG project slippage is common. If, for example, 30% of the 113 mtpa due onstream by 2020 were to slip past 2020, the ratio would drop back down to 0.72.
")
So there is a relationship between liquefaction capacity and the LNG carrier fleet, though it is not specifically one-to-one. And while there are clearly many relevant factors, looking at supply-side ratios such as mtpa/vessel can be a useful high-level approach. In a sense, LNG projects constitute one more thread in the rich shipping tapestry. Have a nice day.
(Source: Clarksons)
")