The world of seaborne trade spreads across a wide range of commodities and goods. But in terms of growth, at any point in time some elements look overweight or underweight compared to their share of trade in total. And once distance by sea comes into the equation, things can be even more complex. This week’s Analysis examines the tale of the scales since the downturn of 2009.
The wide spectrum of seaborne trade is well known, with a range of cargo types contributing to a projected 11.5bn tones this year. Crude oil and oil products account for 27% of the total, dry bulk for 44% and containers for 16%. World seaborne trade has grown by 38% (an extra 3.2bn tonnes) since it slumped by 4% in 2009, but changes to the cargo shares over time are gradual. So, in term of understanding where the extra ‘weight’ has been put on, it’s necessary to look a little closer at what has been added.
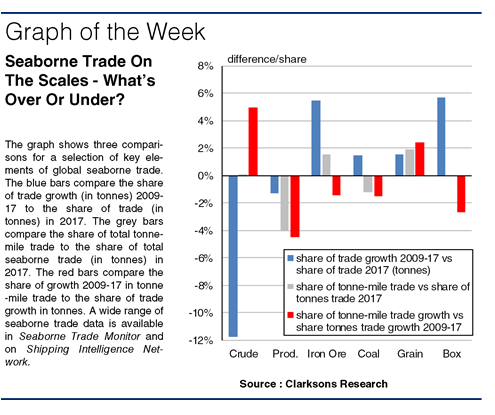
One interesting comparison is to contrast the share of the growth in tones since 2009 with the actual share of trade this year. As the graph shows, there can be quite a difference. Iron ore backed by continued Chinese demand, has accounted for 18% of the growth in seaborne trade since 2009, a positive difference of 5% against its 13% share of trade. Container trade (in tonnes) has accounted for 21% of the growth in the period, with a differential of 6%. Meanwhile combined crude oil and oil products trade has accounted for just 14% of the growth since 2009, a negative difference of 13% compared to its share of trade this year.
")
A second set of interesting comparisons take distance into account. Firstly, a quick comparison of the importance of the different cargoes in both tonnes and also in tonne-miles highlights a couple of instructive patterns. Dry bulk trade is estimated to account for 49% of the total tonne-miles this year compared to 44% of the tonnes. Oil products, with a greater prevalence of intra-regional trade components, provides 9% of the trade in tonnes but just 5% in tonne-miles.
Secondly, this leads to a comparison of the difference between the ‘weight’ put on in terms of tonnes and tonne-miles since 2009, and this throws up some interesting trends too. Grain (including soybean) accounts for 8% of the growth in tonne-miles but just 6% in tonnes, whilst crude oil which accounted for 6% of growth in tonnes has contributed to 10% of the growth in tonne-miles. In both cases trade flow from the Atlantic to China has had a key impact. Box cargo, meanwhile, put on 21% of the growth in tonnes but only 18% in terms of tonne-miles.
So, there are a number of ways to examine where the balance of seaborne trade has altered. Key dry bulk cargoes and containers have added much of the weight, but adding in distance to the vessel demand mix, a top-up is notable in both grain and even crude oil. These ongoing changes just go to show how tricky managing the weight is for shipowners trying to second-guess the seaborne trade scales.
(Source : Clarksons)")