When shipping markets start to move into the next phase of the cycle following a downturn, sometimes the percentage increases in earnings can look very impressive indeed. But of course they’re generally from a low base. With some of the shipping sectors now moving into a new phase, how else might the improvements be put into a helpful context?
Turn Time?
Clearly the percentage increase in earnings in each sector doesn’t really capture the essence of the relative position in the market cycle. Across September, earnings for a 2,750 TEU containership were up by 55% since Aug-16, and Capesize spot earnings were up by more than 800% since Mar-16. But of course that doesn’t mean that these markets are in the rudest of health just yet.
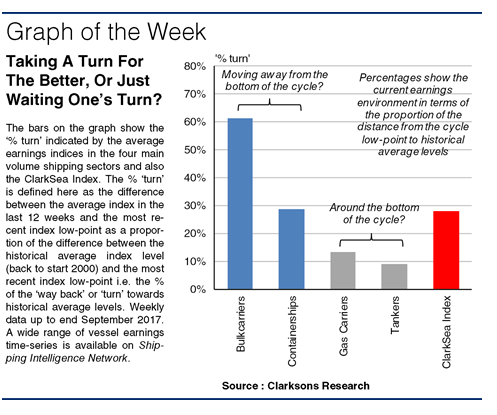
A more helpful measure of the progress of the cycle might be to look at how far a sector has progressed on its possible journey (often not a smooth or complete one) between the ‘low-point’ in the cycle and the historical average level (potentially reflective of a greater degree of equilibrium). Here this is examined for four key market average earnings indices (basis historical average since start 2000=100), and the ClarkSea Index itself, to see what this ‘% turn’ tells us.
")
A Turn For The Better?
Boxship charter earnings have increased in 2017 so far, with the earnings index averaging 61 in the last 12 weeks, up from 45 in Dec-16 at the bottom of the cycle. That equates to moving 29% of the way back to historical average levels, which seems like a fairly good guide to where the containership sector stands in the cycle. Bulkcarrier earnings have also increased this year with the earnings index averaging 70 in the last 12 weeks, up from 21 in Feb-16, a record low for many segments in the bulkcarrier sector. That is equivalent to moving 61% of the way back to historical averages. This seems a little aggressive, perhaps reflecting some additional seasonal impetus to the market recently, and of course the historically very low starting point. Taking the 2016 index average as the low point instead, earnings would be 51% of the way back.
The story is clearly completely different in the tanker and gas carrier sectors. In both sectors earnings have in the main been easing back for some time now, and the most recent lows are very recent indeed. The average tanker earnings and gas earnings indices in the last 12 weeks lie very close to the most recent market low points. The ‘% turn’ at 9% and 13% respectively is not really the key feature of these sectors today.
")
Turn Again?
This ‘relative’ approach can provide an idea of how far the markets have moved into the next phase of the cycle (or not). The ClarkSea Index, which topped $12,000/day for the first time since Jan-16 in September, is 28% of the way back to historical average levels. Although sentiment and earnings levels are looking more positive in some sectors, simple percentage gains don’t tell the whole story. Volatility remains and there’s likely to be some way and more re-balancing to go to arrive at potentially much happier times for investors.
(Source : Clarksons)")