A well-known football manager once commented on the “bouncebackability” of his team after they had followed a defeat with a victory. This year and last, global seaborne trade growth, following a weaker performance in 2015, has illustrated its ability to bounce back strongly, and on the back of a range of positive trends is currently expected to reach close to 4% in full year 2017.
")
Bouncing Back
Aggregate world seaborne trade is projected to grow by 3.9% in full year 2017. This follows on from growth last year of 2.8%, which itself was a major bounce back from the sluggish growth of 2.1% registered in 2015, which had triggered many to think twice about the general long-term health of seaborne trade. If this year does achieve the 3.9% mark, it would constitute the fastest year of seaborne trade growth for 5 years, since the 4.3% growth in 2012, a real bounce back to form.
As well as representing a healthy bounce back, the rate of expansion this year holds up well in historical terms. The average since the downturn in 2009 (when seaborne trade shrank by 4.0%) has been 4.2%. Excluding the year of 2010, which was a huge bounce back in its own right (9.3% growth) the figure would be a more modest 3.4%. The average in the 2002-08 boom was not too much higher at 4.5%.
")
A Game Of Two Halves?
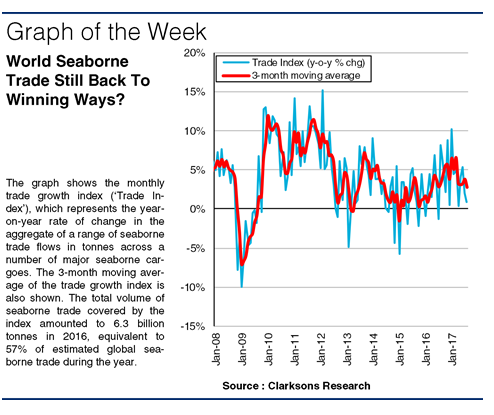
The graph shows the monthly progress of seaborne trade based on a ‘basket’ which covers elements that can be tracked monthly (close to 60% of all seaborne trade in 2016). This currently shows two distinct parts to this year so far. The average year-on-year growth stood at 5% in Jan-Apr, whilst in May-Aug the rate averaged a slower 3%. However, as the graph shows, both compare favourably to full year 2016; in reality the more recent months saw greater volumes in 2016 than the early months of the year, easing the year-on-year growth rate down.
")
A Strong Season
There have been lots of supportive trends this year: resilient dry bulk imports to China, a return to coal trade growth, robust intra-Asian box volumes, rapid transpacific container trade growth and burgeoning gas volumes. Of course, downward pressures exists too (such as the OPEC cuts) and the future is not without risk (Chinese factory closures, Trump economics, Brexit, re-shoring or new technology).
But to many observers, with seaborne trade projected to expand at a multiple of 1.1 times global GDP growth this year, there’s now a clear signal that some of the distress arising from much slower trade growth as recently as 2015 was actually more likely the passing of the low point in a cycle. The resilience of seaborne trade brings with it backing for more positive sentiment.
")
What’s The Score?
Whether that’s justified or not in the longer term remains to be seen; it will pay to keep a close eye on the statistics. But if this year’s numbers (so far) show anything, it’s to confirm that the seaborne trade growth environment still retains the ability to bounce back from difficult results.
(Source : Clarksons)