Shipping markets are by their nature cyclical, but anticipating the timing of market cycles is rarely easy in practice, not least because shipping’s cycles are so enmeshed with other economic cycles, notably in underlying commodity markets. For example, while some of the key shipping sectors appear to be moving into the next phase of the cycle, current oil market uncertainties are complicating matters elsewhere.
")
Oil is one of the headline global commodities and no wonder: it meets around a third of all global energy needs. From a shipping perspective, quite apart from the bunkers currently used to fuel the vast majority of ships, the seaborne oil trade (40m bpd of crude and 24m bpd of products in 2017) is the raison d’etre of the oil tanker fleet of over 10,000 vessels, while the mobile offshore fleet of over 13,000 vessels is involved in producing 26m bpd of oil offshore (28% of global oil output).
In the wake of the global financial crisis, oil prices bounced back quickly and remained high. Brent averaging $103/bbl in 2010-13, as oil demand growth exceeded supply growth in most years. This supported a boom in the offshore sector and peak-of-cycle rates, for example $510-650,000/day for an ultra-deepwater floater in West Africa (80% above today’s 20-year average). Tankers, however, went through a period of depressed earnings, with oil demand and trade growing at a slower rate than fleet capacity.
")
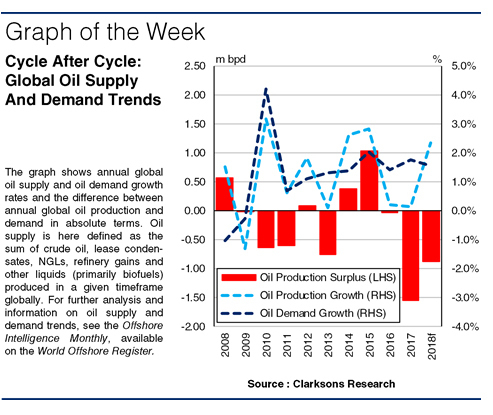
In 2014, the wheels came off oil prices, with world oil supply swinging into a surplus: US shale had unexpectedly added 2.1m bpd to global oil output from 2012 to 2014 (see SIW 1,311). As the graph shows, oil production exceeded demand by 0.4m bpd and 1.0m bpd in 2014 and 2015, and Brent fell to $30/bbl in early 2016. This was very challenging for offshore, but cheap oil stimulated demand, which grew by 2.0% in 2015, lifting the tanker market: VLCC spot earnings averaged $64,914/day in 2015, thrice 2013 levels. Various factors ? the OPEC agreement in Q4 2016 and outages in Nigeria, Libya and Venezuela ? then saw oil supply to swing back into deficit (1.6m bpd in 2017), supporting rising if volatile prices.
So far in 2018, oil has been highly volatile in the $60-$75/bbl range, partly because there are many contradictory price signals. OECD oil stocks are almost back to the five year average, the OPEC target level, and the group has floated a 2019 cuts extension. But US shale oil output has grown m-o-m by an average of 1.9% since start 2017 and total US production recently passed 1970s records. In the consensus view, oil demand is still expected to exceed supply in absolute terms in 2018. Though with supply growing more firmly than demand, narrowing the gap, a move along the cycle is not assured. Things are clearly uncertain, and wildcard political risks exist too.
")
So in actuality the oil market may or may not be poised for an upswing, and the meshing of shipping and commodity cycles means the latter can influence the former, for example in tankers and offshore. Shipping cycles are important but evidently not the only ones to watch.
(Source : Clarksons)