Along with cyclicality, the other characteristic of the shipping markets which receives frequent mention is volatility. This is so evident that the shipping markets are often reported to be many times more volatile than the stock markets or other fluctuating economic variables. Here we take a look at some metrics which shine some light on the relative volatility of the industry.
Many metrics can be used to measure aspects of volatility (though none are perfect). A few are calculated here to compare volatility in the shipping markets with that in the stock and commodity markets. One classic measure of volatility is the ‘coefficient of variation’ which takes the standard deviation of a series over time (a measure of the degree of dispersion of observations in a series) and divides it by the mean (average) level of the series.
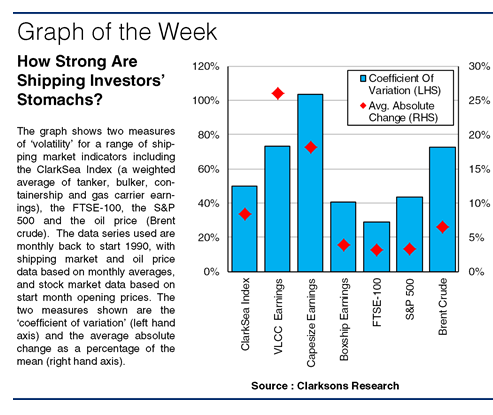
This metric highlights the degree of volatility present in the shipping markets (see graph). For the ClarkSea Index it stands at 50%, for VLCC spot earnings 73% and Capesize spot earnings 104%. For the FTSE-100 the figure stands at 29% and for the S&P 500 43%. The stock markets, often thought highly capricious, appear to be quite a bit less volatile than shipping on this basis (and given that stock markets generally track a trend rather than a cycle, one might have expected their coefficients to be biased upwards).

The oil price compares more closely to shipping; the figure for Brent crude stands at 73%. Another useful metric is the average absolute monthly change as a percentage of the mean. For the ClarkSea Index this stands at 8%, for VLCC spot earnings at 26% and Capesize spot earnings 18%. For the FTSE-100 and S&P 500 this stands at around 3% and for Brent at around 6%, so again much lower.
Of course this analysis doesn’t capture everything. It excludes week-to-week (or day-to-day) volatility, though one might suppose that this could further emphasise shipping’s volatility (for example, see VLCC spot earnings on page 2). Equally it does not handle (or ‘de-trend’) indicators differently to account for the fact that stock markets typically follow a long-term trend, rather than a cycle like shipping.

But, even using a regression approach to ascertain variation from simple trend levels, over 60% of the FTSE-100 movement is explained by the trend. In shipping, much more of the variation appears to remain ‘unexplained’ (less than 10% of the variation of the ClarkSea Index would be accounted for by a simple trend).
So, volatility in shipping easily holds its own against fluctuations in other economic phenomena. It’s a competitive business, and rapid changes in pricing can be driven by the steepness of the supply curve at the margins, as well as a range of quite unpredictable factors.

This helps make shipping interesting for asset players and short-term speculators but tricky for investors looking for certainty of return and analysts looking for a clear picture. Like seafarers themselves, shipping market players can quite rightly point to having the stomach for ups and downs as much as anyone.
(Source : Clarksons)