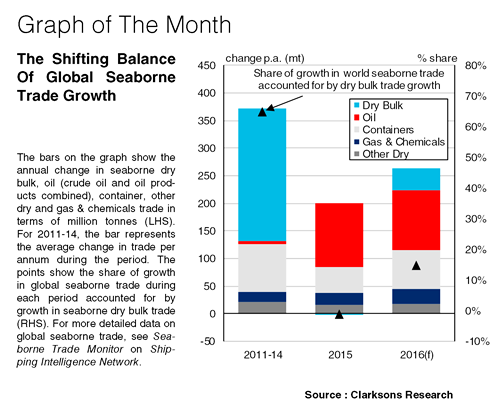
Global seaborne trade growth appears to have experienced mixed fortunes in recent years. In 2015, world seaborne trade grew 1.9%, to total 10.8bt, following an average increase of 3.8% per annum between 2011 and 2014, but current trends indicate that seaborne trade growth could accelerate in full year 2016. Meanwhile the drivers of growth appear to have been subject to notable shifts.
Figures show that world seaborne trade grew steadily in 2011-14, largely supported by a rapid rise in dry bulk trade. Expansion in seaborne dry bulk trade during the period accounted for 65% of overall global seaborne trade growth as continued economic development in China bolstered the country’s dry bulk imports.
Meanwhile, container trade expansion was also a significant component of total seaborne trade growth in this period, accounting for 23% of overall trade expansion. However, growth was not balanced across all sectors, with seaborne oil trade (crude oil and oil products combined), considered to be fairly mature, growing on average by just 0.1% p.a. over the four years, barely contributing to world seaborne trade growth.
In 2015, the mix of growth moved in the opposite direction, with dry bulk trade declining slightly. The drop was underpinned by a 2% fall in China’s seaborne dry bulk imports, which rose on average by 11% per annum in 2011-14. Meanwhile, global box trade growth in terms of tonnes slowed sharply to 2.9%, partly due to a fall in peak leg Asia-Europe trade, a slowdown in intra-Asian volume growth (due to turbulence in China’s economy) and the impact of the drop in commodity prices on box imports into key commodity exporting developing countries. Elsewhere, seaborne oil trade rose 4.1% to 2.9bt in 2015, partly supported by the oil price collapse. Growth in oil trade accounted for 58% of total seaborne trade growth in 2015; a stark contrast to its share in previous years.
This year, the emphasis has shifted again and world seaborne trade growth is projected to be more balanced. Chinese dry bulk imports have surprised on the upside in 2016 so far and dry bulk trade is expected to account for 15% of total seaborne trade growth in full year 2016. Meanwhile, concerns about sluggish box trade have eased slightly, with year to date indicators suggesting an improvement in Asia-Europe trade and a pick-up in intra-Asian trade growth.
Box trade looks set to account for almost 30% of world seaborne trade growth. Meanwhile, growth in oil trade is projected to remain healthy and account for around 40% of global seaborne trade growth. Overall, despite risks remaining, world seaborne trade growth is projected to pick up in full year 2016, to 2.4%, historically still a little subdued but more sprightly than in 2015.
So, there have been plenty of interesting dynamics on the demand side in recent years, with seaborne trade growth experiencing varied fortunes. Notably, the mix of components driving volume growth has shifted significantly more than once. This year, the constituent parts look more balanced than before, but market watchers should keep their eyes open for further changes in the pattern of trade.
(Source : Clarksons)