Back in the past the gas shipping sectors may have been considered relatively niche within the world of global shipping. However, in the last two decades they have been amongst the faster growing parts of the industry. This week’s Analysis takes a look at how shipping’s ‘coolest’ sector has grown in prominence to become part of the mainstream, and some of the ups and downs along the way.
Gas (LNG and LPG) shipping may once have been considered by some as a relatively niche part of global shipping, with the fleet and trade volumes dwarfed by other sectors. Even today, LNG and LPG carriers account for just 5% of total world fleet GT, and LNG and LPG trade accounted for just 3% of global seaborne volumes in 2015. However, following phases of rapid fleet growth, the combined gas carrier fleet now stands poised to top 100 million cbm of gas carrying capacity next year, more than double the size of the fleet at the end of 2007.
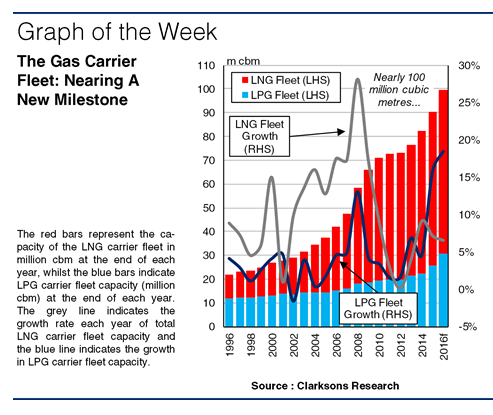
Following expansion in LNG trade in the late 1990s, in the mid-2000s a glut of new export terminal sanctioning led to a surge in LNG carrier contracting, peaking at 10.9m cbm in 2004. This supported average fleet growth of 15% p.a. in the period 2000-08, to 40.3m cbm at the end of 2008. In comparison the LPG carrier fleet grew more steadily, though trade growth was supported by increased export volumes from the Middle East and Europe.
Between 2000 and 2008, LPG carrier capacity increased from 13m cbm to 18m cbm, at an average rate of growth of 4% p.a. Across this period combined gas carrier capacity grew by an average of 10% p.a. to total 58.2m cbm by the end of 2008. However, after the economic downturn, sanctioning of liquefaction projects slowed, which limited LNG fleet growth, and growth in the LPG sector slowed too. Between 2008 and 2014, combined gas carrier fleet capacity grew by a much less rapid 6% p.a. on average, with even slower growth in 2011-12.
Nevertheless, since the start of 2015 it has been full steam ahead for the gas carrier fleet. With LNG carrier ordering backed by the return to liquefaction terminal sanctioning in the 2010s and the vision of a cleaner energy future, and LPG carrier demand supported by the advent of fracking in the US and refinery capacity expansion elsewhere, 26.1m cbm of combined gas carrier capacity was ordered in 2013-15. This has supported rapid fleet growth in recent years and since the end of 2014, LPG carrier fleet capacity has grown by 32% and LNG carrier fleet capacity by 12%.
So, the gas sector’s profile is fully in the mainstream today, and despite it’s relatively limited share of the world’s tonnage and global seaborne trade, in other ways it accounts for rather more weight. Gas carriers are complex, high value units; they account for 15% of the shipyard orderbook in CGT (shipyard work) terms today, and for an estimated value of $78bn, 9% of the world fleet total. And with a 20-year compound annual growth rate of 8% in combined capacity, and the 100 million cbm mark just around the corner, surely that’s one of modern shipping’s success stories? Have a nice day.
(Source : Clarksons)